Who is this written for?
It is written for anyone who wants to start working with analytics, we will go through basic work methodology for working with analytics (it can be anything from building a report for your KPIs to an advanced predictive model). We will assume that you have a certain understanding of what “agile” is but will still go through how that approach can be applied to “analysis”. If those bits seem too trivial, you can skip it. The text is written from the “facilitator’s” perspective but can be read by everyone.
Background
This methodology was developed in its first implementation during an assignment for a major player in the insurance industry and was then named “BIP!” (Business needs analysis, Information Modeling and Prototyping) but has since been developed and is now called “Agile Analytics”. Similar methodologies exist and have existed for quite some time, all with the same aim of aligning business and IT to create value from the data a company creates. It was also taught as part of SAS Institutes Analytics Value Training Program.
The insurance company in question, like many organizations, had the challenge of translating business needs around analysis into actual reports that create business value in an efficient way. Lead times were often long and, in the end, many needs were missed despite the long development time. To remedy this, we created a new agile way of working where we compressed the work into short iterations where we focused on the most value-creating needs first.
Purpose
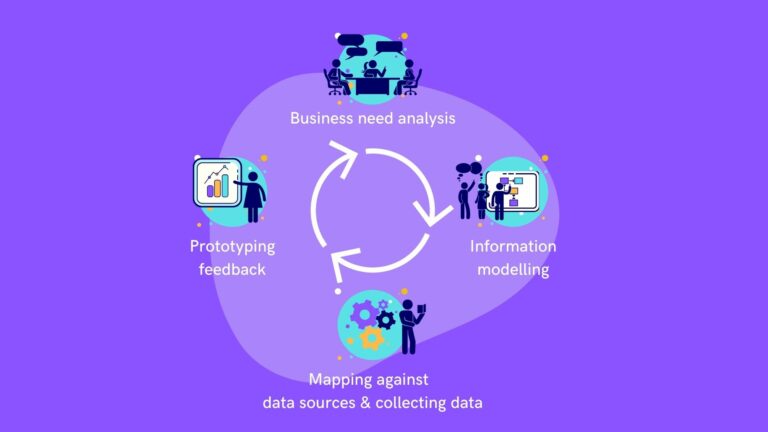
The main purpose of this methodology is to quickly capture the business needs around analysis, transform into a concrete information model & prioritized business questions, map against source data and build a prototype to be able to quickly get feedback from the end user. An iteration need not take more than a few hours if the work is prepared in advance.
Workflow
Broken down, this work is carried out in four steps, where the last step is a gathering and feedback session, but this can be done in the same sitting also if you have the right people with you during the workshop. Typically you have three groups of individuals who need to be involved
- Customer with the business need
- Individual with an IT background who knows the customer’s source system and the data contained there. Essentially, this person understands how a business process generates data and what it means in the source system.
- “We” represent facilitation, modeling and prototyping capabilities.
Business Needs Analysis (WS)
A Business needs analysis is an open, in-depth interview in workshop format that we conduct to capture key concepts (core business concepts like “Order”, “Customer” and so on), their descriptions (attributes, like “Order value”, “Customer Name” etc) and their internal relationships. When we conduct this WS, it is important to have an open mind, as it is a very open format to get the customer to tell as much as possible. In the early phase of the WS, we work with open ended questions so that we really capture what is most important to the customer. As we begin to get a better picture of what kind of information covers their needs, we will ask more closed questions in order to get a clearer alignment that we have a common picture.
- Closed questions often begin with “Have you …?” or “Is it / Are you …?” and aims to provide concrete information, can even be “yes or no” answers.
- Open-ended questions begin with question words such as “How”, “Why”, or “What”. This type of question shows that you are interested in how the person thinks and feels about the topic of conversation. It gives the person space to speak, think and invites them to talk about what is current and important.
Listen for nouns, verbs and adjectives, often the verbs translate to events and relationships that are relevant and the nouns to core business concepts (entities) in later models. Also be alert for words that are repeated often, this is a strong indication that it is a concept that means something important to the business. Adjectives are often used to describe a core business concept, which gives us a better understanding of what attributes the entities should have to answer their business questions.
It’s important to let the business speak freely during these meetings, IT should not control the conversation or think about whether what the business says fits into existing data or models. Maybe something is important that the operational systems arn’t capturing and development needs to be done there as well. This is why we encourage the business to speak freely, by asking open-ended questions to gain more insight into exactly what the various concepts mean.
Example:
Closed question:
- Do you need this data?
Open question:
- How do you intend to use this data?
Who does what, how, when, where and why?
Seriously, this is what we want an answer to when the WS is over, but we need to take it at a better pace than just throwing the question out that way, of course, we need to understand:
Why?
- Why are we doing this? I.e. why is the business process needed?
What?
- What do you actually want to measure? What kind of phenomenon/event is it?
Who?
- Who performs the action that causes the phenomenon/event? Who is interested in following? Why?
- We are looking for connections here and motivation for why it’s interesting to measure the information.
How?
- How does the phenomenon/event occur? How many? How often? How much?
Where?
- Where does the phenomenon/event take place? This is relevant if you have that type of event
When?
- When does it occur? At what frequency?
Important question that the business needs to consider: Why do we need answers to these questions? What is the business benefit of this? What should the business do with the information? Building reports that has unclear reason for existence is building dead reports.
Tools you will use: If it’s physical, post-its, if it’s a virtual tool like miro or Lucidspark.
Output from the meeting:
- Rough sketch of information model at “post it level”, capturing the core business concepts, their relationships and definitions are most important, attributes are a secondary at this stage and can easily be followed up “offline”.
- A prioritized list of their important business questions that should be specific enough to create visualizations around. It might be surprising but it often takes a couple of tries before we get good business questions. Often we get responses like “number of customers!”, see, there is no question mark in the end, hence not a question. Second try usually ends up in something like “How many customers do we have?”. Much better, so i’ll create this dashboard with one big number in it, happy? No? Try again. An example of a good business question can be “How many new customers do we get over time and product category?” Now this question can be used both to validate the information model by seeing if we have all the core business concepts, relationships and attributes needed to answer it. But also very helpful once we get started with building prototypes for the business based on the model.
Checklist before & during the meeting:
- Come prepared, be well-read on what the customer’s business is.
- Start the meeting by sharing your idea of what the scope of the meeting is. You can test it by a negating question of the type “What in this presentation of the scoop do you think is not correct?” This forces the customer to think.
- Don’t forget: Assumption is the mother of all fuck-ups, don’t assume you know their business better than they do, you probably don’t so be open and avoid anchoring the customer’s train of thought in your own when leading the WS.
Information modeling
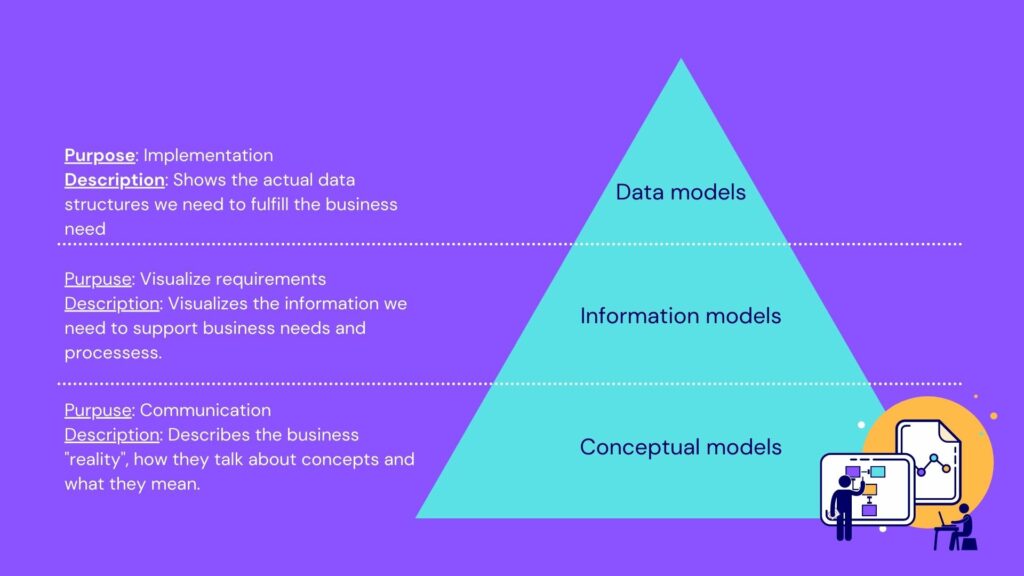
This is an activity we do internally, but we are using the first WS to start understanding this. But what is an information model and how does it differ from conceptual models and data models?
The image below describes the different modeling types, their purpose and how it is documented. The only thing I would personally like to add to this strict definition is that an information model is also a communication tool and not only a requirement setting tool.
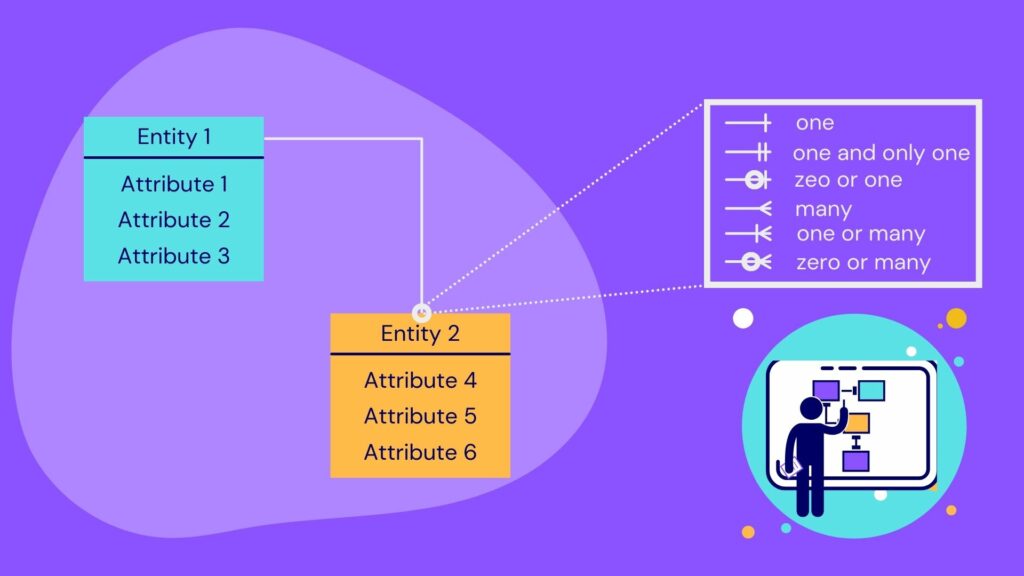
The information model’s building blocks and notation
- Entities
— Our main objects, during the interviews these often appear as nouns that are repeated often during the conversation. - Relation
— The relationship between different entities, during the interviews these often appear as verbs in relation between the different entities. - Attribute
— Properties that the entities have, during the interviews these often appear as adjectives that describe the frequently occurring nouns
How we document an information model:
There are a few different ways to do it, but clarity and simplicity are most important for an information model. Customers who have never seen an IM before should be able to quickly understand how the business’s information is connected.
Output from this activity:
- A digital version of the information model you started building during the first WS
- Cleanly written and clearly made business questions, you may need to have shorter conversations with the customer to confirm that you understood correctly.
- Definitions in writing of your entities and attributes.
Checklist during this activity:
- If you are unsure about something, call the customer. It is likely that the customer has not been clear and may need help defining
- Don’t accept vagueness in definitions, if you do it will be a problem later when you have to map against the data. It may be that the customer does not manage to give a sharper definition, then you need to make a note of this in order to show during the prototyping phase how different definitions produce different outcomes.
- Agile mindset doesn’t have to be perfect, we should have an iterative and experimental approach to create as much value as possible in the shortest time.
Mapping to Data Sources (WS)
In this situation you ideally have a pretty good information model, you absolutely don’t need to have all the attributes in place but the most important attributes that help answer the prioritized list of business questions should be there and you need to have a good idea of what the different entities, attributes and the relationships mean.
The purpose with this WS that “the business” does not really need to be involved in, is to map which data sources, tables and connections we need to make in order to be able to answer the most important questions of the business.
Tools you will use: If it’s a physical, whiteboard where you draw up the digital information model (don’t underestimate the value of having it drawn up), if it’s a virtual tool like miro or Lucidspark.
Output from the meeting:
- List of data sources
- Mapping if possible between KPIs, data sources and datasets
- Any integrations we will need to implement. A lot of the time, the first WS makes IT and business realize that some data points are not being logged or are not passed on to the analytical data store (data lake / data warehouse or similar), this becomes extra clear in this session. This also means that we have to give feedback to the business regarding what business questions can’t be answered until the issue has been fixed. Be proactive and let them know what could be answered instead.
Checklist before and during this activity:
- Come prepared, be well-read on what the customer’s business is.
- Start the meeting by sharing your idea of what the scope of the meeting is. You can test it extra by a negating question of the type “What in this presentation of the scope do you think is not correct?” This forces the customer to think.
- Get an idea of which systems the data you need answers to is in, this is the easiest way to do it
- Ask the IT team to send over data models for the systems you believe are relevant to answer the business questions you have listed with the customer beforehand so you can prepare.
Prototyping
Once you have your data in, you can quickly build a prototype on the data, at this point you have the prioritized business questions, the information model, define the first KPI candidates and have an idea of what kind of data will be required to create the visualizations. When you prototype the dashboard, you will probably find that you need to make adjustments, which will become even more noticeable during the next step when you sit with the receiver.
here’s how you know which type of graph fits which type of data:
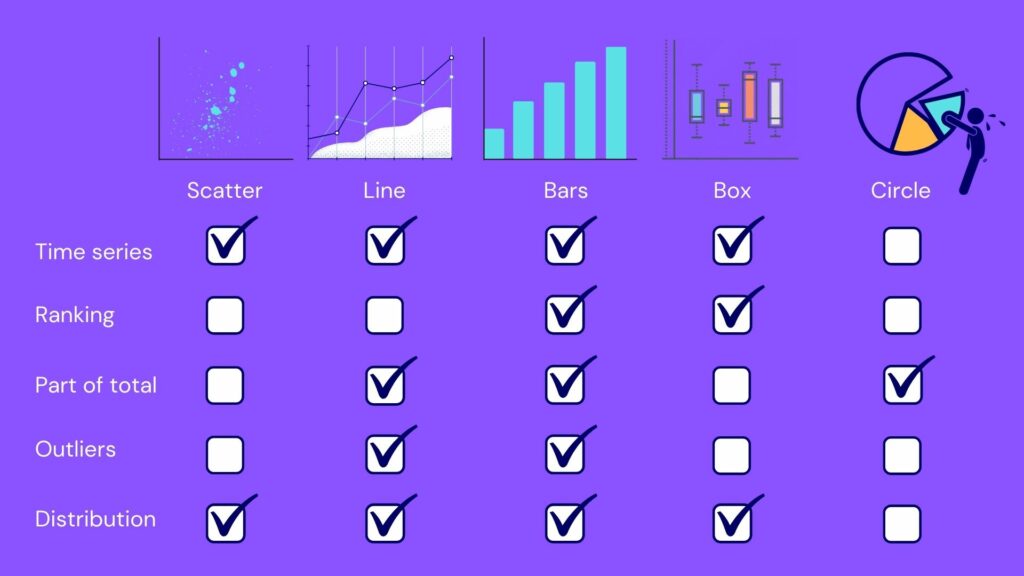
This forms the basis, then there are more advanced types of graphs that can fit more narrow areas of use such as word clouds, heatmaps, various maps and sankey diagrams. But focus on the basic chart types in the first iteration as you want to keep it as simple as possible, remember the important thing is to get feedback quickly about whether we are working with the right data, KPIs and definitions as these will be the most time consuming to build data transformations for.
Presentation & Feedback session (WS)
During this session, the focus for the “business” is to give feedback on the prototype we’ve built together.
The purpose with this WS is to identify if our prototype is good enough as a first MVP to go into production with, as well as what next steps we should implement apart from production.
Tools you will use: If it’s physical, screen, whiteboard where you draw up the digital information model (don’t underestimate the value of having it drawn up) and write down the business questions captured during the needs analysis, if it’s a virtual tool like miro or Lucidspark.
Output from the meeting:
- Is the prototype good enough to go into production as an MVP? If not, what do we need to change / improve / add?
- Create some new “next steps” that we can add to the development backlog after the MVP is implemented.
Checklist before and during this activity:
Important issues to raise during this workshop are:
- Does the dashboard prototype answer the business questions we identified during the Business needs analysis step? If not, what have we missed?
- Can we identify low-hanging fruits already now in terms of improvements? Look out for things that are easy to implement directly in the visualization tool and simpler business rules, segments or similar that could be added.
- Sometimes it can happen that when the business side / stakeholder sees their data, they get
- New ideas on what they would like to see implemented, capture these and prioritize them on the spot.
- They realize that the exact thing they asked for might not be that important anyway, “but if they only got X, it would add value.”.
In conclusion
We’ve seen a methodology here that can be used to actually capture and develop analytics needs in an agile way. Much of the success of this way of working depends on the facilitator’s ability to both engage and help navigate the discussions. It is important for all parties to focus on what is most important to solve right now, typically it’s good to try to catch low hanging fruits that creates a lot of value for the business, save the more complicated requirements for later.